
From Tables to Scalars in DAX: How VALUES, SELECTEDVALUE, HASONEVALUE, and CONCATENATEX Work
- Stefano Meloccaro

- Mar 27, 2025
- 3 min read

Have you ever written a measure and, when plotted into a chart, got an error message saying that the function returned a table when a scalar value was expected?
If so, here's why: Some DAX functions — like VALUES(), ALL(), or FILTER() — return tables, not single values. But when you use them directly in a measure, Power BI return an error as it expects a scalar result (like a number, text, or Boolean) not a table. If the function doesn't get wrapped inside an aggregator (like COUNTROWS, SUMX etc) or converted in a scalar function the measure fails — because charts and cards can only display scalar outputs, not entire tables. That said let's see how to convert tables into a scalar output using DAXfunctions like VALUES, SELECTEDVALUES, HASONEVALUES and CONCATENATEX.
The first option is to use Values; even though it's a table function, when the table contained on it is reduced at just a single row and a single column it returns a scalar value. Let's say for example that we have an eCommerce and we want to visualize how many brands are assosiated to the product category we have. We could plot then a visual table with the product category column and a measure, like the following, which return the Brand Name.
Brand Name = VALUES(Products[Brand])The only issue with this measure is that each category must be associated with exactly one brand. In mixed scenarios—where some categories have just one associated brand while others have multiple—DAX returns an error because the function no longer produces a scalar result.
To make the measure work correctly, we need to filter the data to include only those brands that have a single, unique association with each category. There are multiple ways to achieve the same result; some of these are the following:
-- Code 1
Brand Name =
    IF(
        COUNTROWS(VALUES(Products[Brand])) = 1,
        VALUES(Products[Brand])
    )
-- Code 2
Brand Name =
IF(
HASONEVALUE(Products[Brand]),
VALUES(Products[Brand])
)-- Code 3
Brand Name = SELECTEDVALUE(Products[Brand])The DAX code above, all return the same output as they all check the same conditions: if the column Products[Brand] has just one value; if so, return that value if not leave it blank.

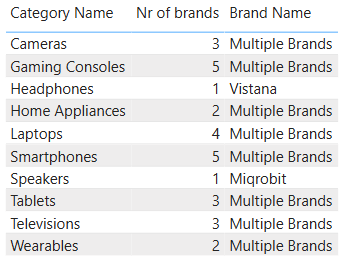
However, even though the result is now more accurate, we can still improve it by handling blank values more effectively. For example, instead of returning a blank when multiple brands are associated with a category, we could display a message like "Multiple Brands", or even better — concatenate all the associated brand names into a single string for clearer visualization.
To achieve this, we have two options:
Use SELECTEDVALUE() with a second argument that specifies a default message when more than one value exists — for instance:
Brand Name = SELECTEDVALUE(Products[Brand], "Multiple Brands")Or use CONCATENATEX(), which iterates over the Products[Brand] column and concatenates all the values into one string, separated by a comma (or any other delimiter):
Brand Name =
CONCATENATEX(
    VALUES(Products[Brand]),
    Products[Brand],
    ", "
)


Thanks for being a part of our community!
If you found this article helpful and would like to show your support, don’t hesitate to:
Clap on this story
Leave a comment below telling me what you think. This will help me with the next articles
Support my work on Buy Me a Coffee ☕️
These actions really really help me out, and are much appreciated!


Comments